Unity Frame Debugger Guide
Purpose and Use Cases
Frame Debugger is Unity’s tool for replaying rendering events frame-by-frame, used to troubleshoot:
- Rendering Order: Is it as expected? (Who draws first/last, when does clearing happen, when is RT written?)
- Frame Composition: Composition and source of Render Events / Draw Calls / Passes within a single frame.
- Batching: Is batching (SRP Batcher / Instancing) working? If not, why?
- Material/Keyword Switching: Excessive SetPass calls or abnormal variant switching.
- Correctness Issues: Pink shaders, missing shaders, incorrect rendering results, transparency sorting, or depth issues.
[!NOTE] Note: Frame Debugger is primarily for troubleshooting correctness and rendering pipelines, not for measuring performance. Enabling it changes the rendering rhythm (sequential playback), so rely on Profiler or platform GPU tools for performance data.
How to Use
Opening
Window -> Analysis -> Frame Debugger
Interface
Debugger Disabled
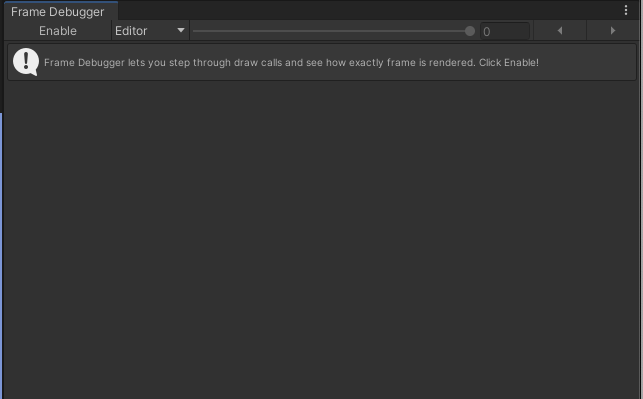
This is the Frame Debugger interface when disabled. Click the Enable button to start debugging.
Debugger Enabled
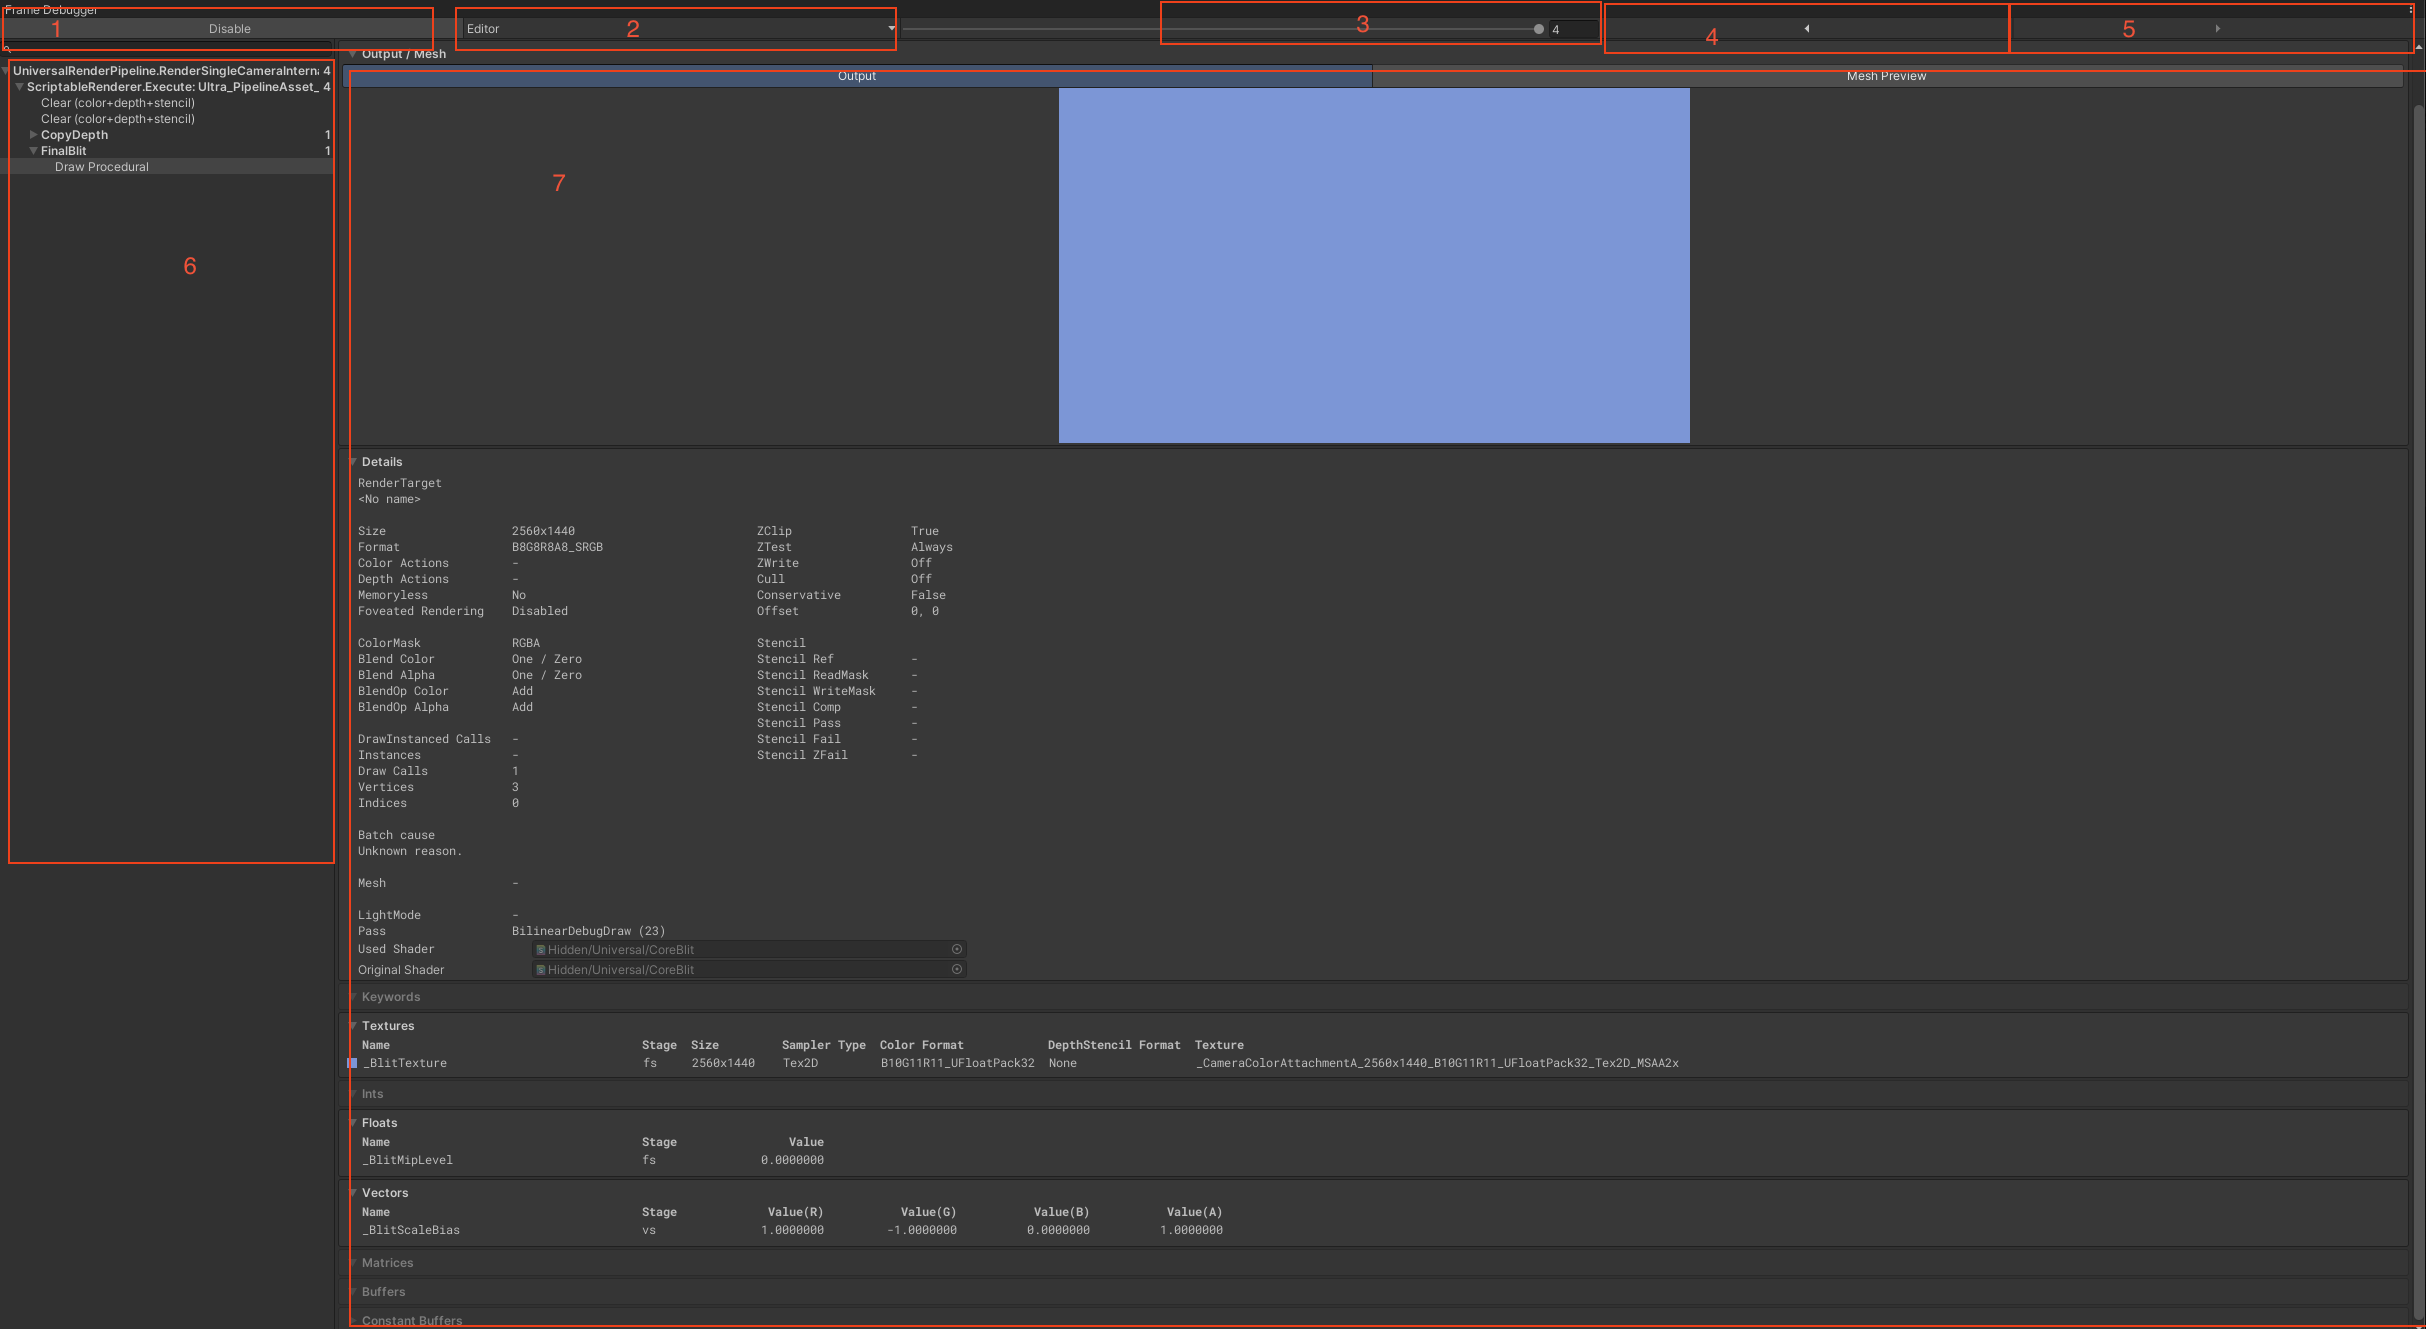
Key elements explained:
- 1 Enable: Toggle Debugger on/off (clicking usually pauses the game).
- 2 Target: Select device to debug. Default is Editor.
- For Editor play mode, select Editor.
- For connected devices/Players, select the device.
- 3 Frame Slider: Current frame index. Slide to scrub through Draw Calls.
- 4 Previous: Jump to the previous Draw Call.
- 5 Next: Jump to the next Draw Call.
- 6 Hierarchy: List of all rendering events in the current frame (chronological order).
- 7 Details: Information about the current draw call, including output render target, mesh, shader properties, etc.
Module 7 (Details) is crucial for debugging to verify if parameters match expectations.
Recommended Workflow (Stable & Efficient)
Step 1: Lock the Problem Frame
- Pause the game exactly when the issue appears (e.g., pink mesh, flickering, sorting error, UI occlusion).
- Open Frame Debugger, select Target, and click Enable.
Step 2: Backtrack from “Final Result”
- Start checking from the bottom of the event list (UI, Post-processing, Overlays depend on earlier passes).
- Select events and watch the preview (Game View updates). identify which specific event breaks the rendering or where an object fails to draw.
Step 3: Pinpoint Draw/Pass/Switch
- Select the suspicious DrawMesh or DrawCall.
- Checks in the Details panel:
- Is the correct Shader/Pass/Keyword used?
- Is the Mesh correct?
- Are there unnecessary material/keyword switches causing SetPass spikes?
- SRP Batcher: If not working, check the Batch cause immediately!
Step 4: Verify in Project
- Common root causes:
- Material instances not shared (same effect, different instances).
- Keyword mismatch (variants don’t match, breaking batching).
- Pass mismatch (same shader, different LightMode/Pass).
- RenderQueue/Sorting/Stencil/DepthWrite configuration errors causing sorting issues.
Common Issues & Tips (High Value for Interview/Dev)
1. Pink (Shader Missing/Variant Missing/Material Error)
- Check the Draw event where pink appears:
- Is the Shader expected?
- Does the Pass exist?
- Do Keywords/Variants match? (Sometimes invalid keyword combinations cause missing variants).
- For deeper GPU-level info, usage of RenderDoc is recommended.
2. High SetPass/DrawCall? Who is switching?
- Locate frequent material switch points in the event list.
- Compare adjacent events: Check Shader, Pass, Keywords, and Render State consistency.
- If using SRP Batcher: Batch cause usually tells you exactly why batching failed.
3. Batching Not Working (e.g., SRP Batcher)
- Confirm SRP Batcher is enabled in project settings (URP/HDRP).
- Check Batch cause in event details.
- Typical reasons: Inconsistent material property layout, different Passes, different Keyword combinations.