Unity Memory Profiler Cheatsheet
This note distills the essential workflow for Unity’s official Memory Profiler: installing the package, capturing snapshots, reading a single frame, and using the compare view to chase leaks or suspicious references.
Use it whenever memory keeps climbing, a device-only build crashes unpredictably, or you simply need to audit resource usage.
1. Installing Memory Profiler
The tool ships as a package. Two ways to add it:
-
Add by name
Window → Package ManagerAdd package by name…- Enter
com.unity.memoryprofiler
-
Search in Unity Registry
- In Package Manager choose Unity Registry
- Search for “Memory Profiler”
- Click Install
After installation a new Memory Profiler entry appears in the Window menu.
2. Opening the window & capturing snapshots
Menu path: Window → Analysis → Memory Profiler
Inside the window you can:
- Connect a device build or simply run the Editor play mode
- Click Capture to grab the current frame
- Each capture produces a
*.snapfile that stores the exact memory state
Select a snapshot from the list to jump into its detailed views.
3. Single-frame analysis: large objects & fragmentation
Use a single snapshot to find assets or allocations that hog memory.
Tree Map
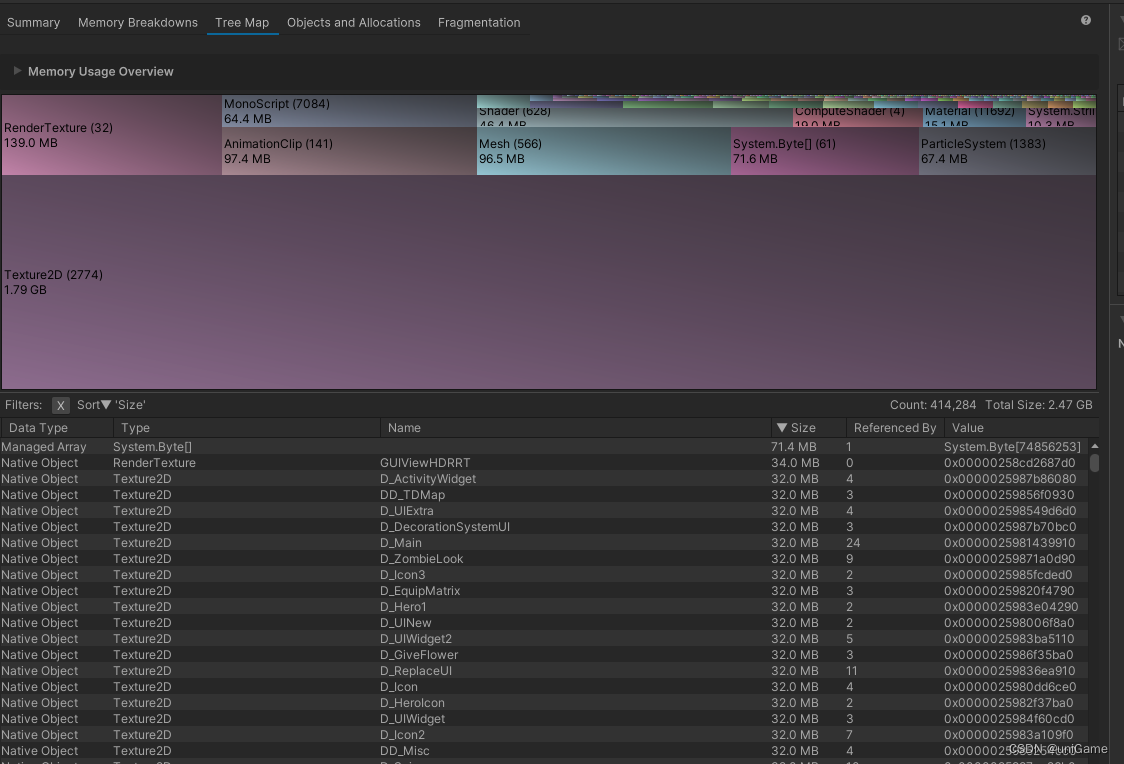
- The top chart groups usage by type (Texture2D, Mesh, AnimationClip, ComputeShader…)
- The bottom table lists individual objects sorted by size
- Quickly reveals oversized textures or meshes
Fragmentation
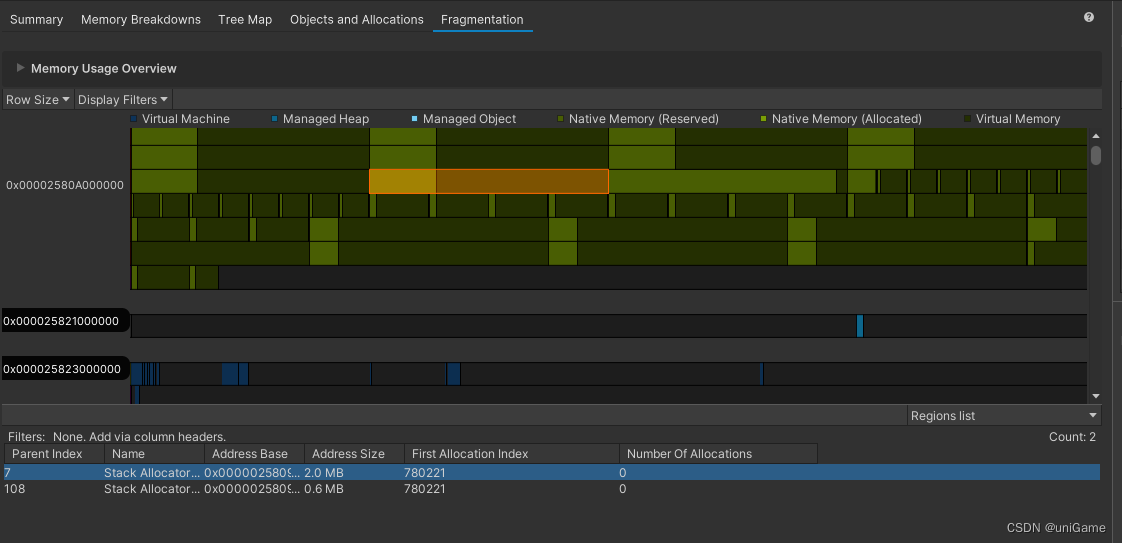
- Colors mark different memory regions (managed heap, native allocations, reserved space…)
- Clicking a block shows details for that address range
- Great for spotting tiny uncollected chunks or uneven heap layouts
4. Comparing two frames: leak hunting
Use Compare Snapshots to catch leaks:
- Capture Snapshot A during a clean state
- Perform the suspect action (repeat scene loads, play 10 minutes, etc.) and capture Snapshot B
- Select both in the window and click Compare Snapshots
Summary tab
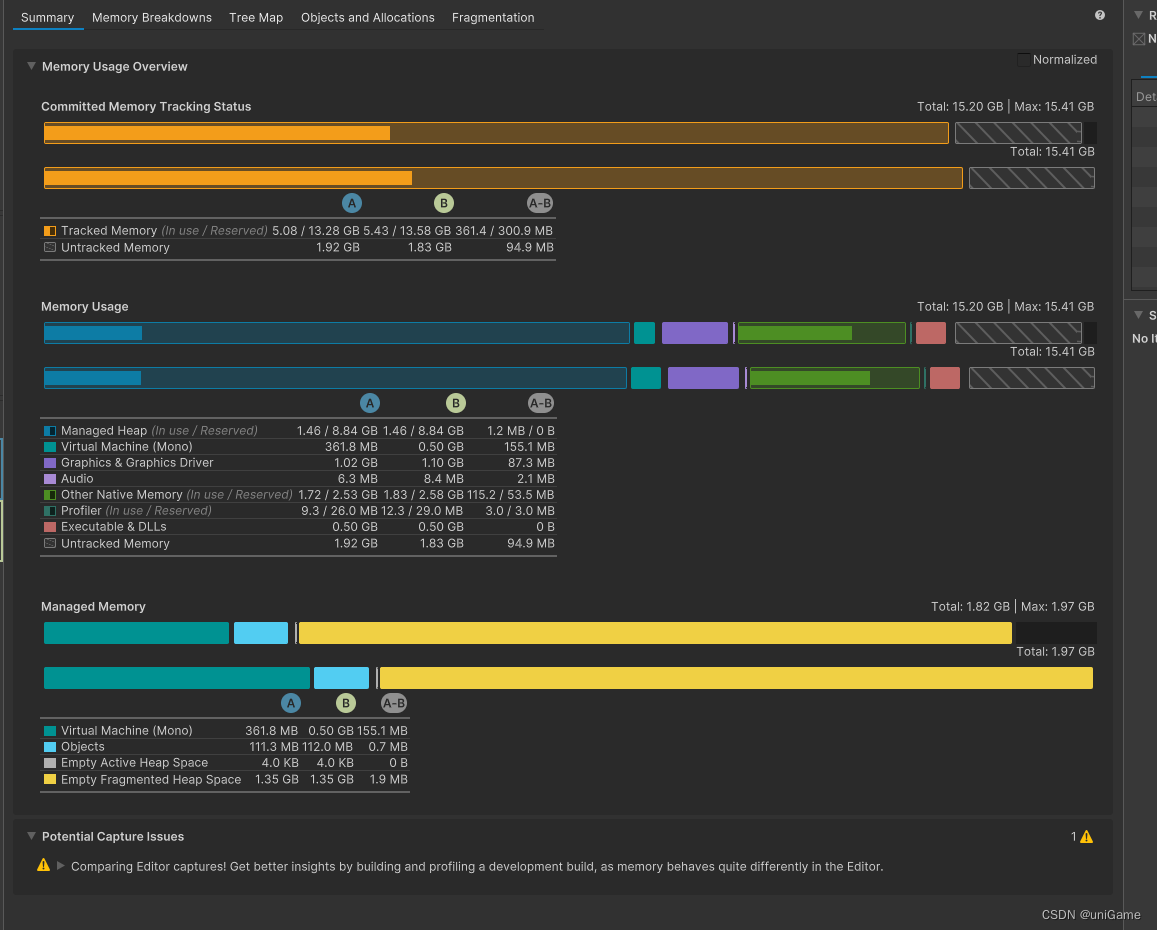
- Shows total memory, managed heap, textures, meshes, etc. for both frames
- The delta column highlights which area grew
Objects and Allocations
Recommended workflow:
- Switch the filter to
DiffandMatch → Newto display newly-created objects only - Sort by Size to triage the heaviest entries
- Inspect Type / Name to guess the culprit
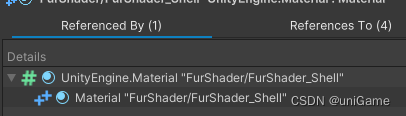
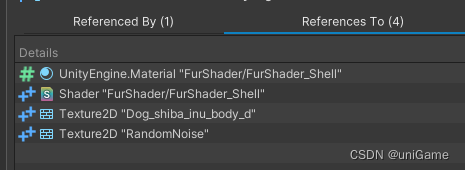
- Use Referenced By / References To to follow the retainers and figure out who keeps the object alive
This exposes:
- GameObjects, textures, or meshes that never get released
- Static dictionaries, singletons, or events that secretly hold references
5. What Memory Profiler is good at
-
Auditing large resources
Find heavyweight textures, models, or audio clips to compress or resample. -
Identifying leaks
Compare before/after snapshots to locate objects that keep increasing and never return. -
Understanding reference chains
The reference views answer the classic “what is holding onto this asset?” question.
Learning to read snapshots is a core skill for Unity optimization: you can only fix what you can see.
Original article (Chinese) on CSDN “uniGame”, CC BY-SA 4.0.
https://blog.csdn.net/alla_Candy/article/details/133272285