Unity Profiler Crash Course
This note covers the basics of Unity’s built-in Profiler: opening the window, understanding the key modules (CPU, GPU, Memory, Rendering), and reading the Timeline / Hierarchy panes to find bottlenecks.
Run it whenever the project needs a health check or frame time spikes.
1. Opening the Profiler
Menu path: Window → Analysis → Profiler
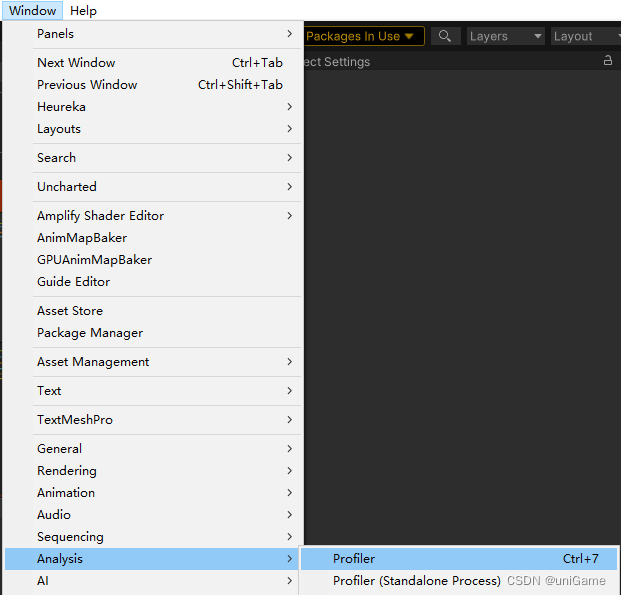
Inside the window you can:
- Profile the Editor directly; or
- Connect to a device / standalone Player via the dropdown at the top
Once connected the curves start streaming per-frame data.
2. Common modules overview
Use the Modules dropdown to pick what you care about:
- CPU Usage – scripts, rendering, physics, GC, UI, etc.
- GPU Usage – GPU pipeline stages
- Memory – textures, meshes, audio, GC heap usage
- Rendering – batches, SetPass, draw calls, visible objects
Toggle modules on/off to reduce noise while focusing on one area.
3. CPU module: find the worst offenders
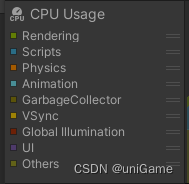
Colored curves break down rendering, scripts, physics, GC, etc.
Workflow:
- Click on a spike frame to lock it
- Inspect the Timeline or Hierarchy below
- Track down the top few functions or systems by cost
If you see GC Alloc constantly non-zero, you are allocating managed memory each frame—look for new, captured lambdas, string concatenations, etc.
4. GPU, Memory, Rendering highlights
GPU Usage
- Shows how long each stage (Shadows, Opaque, Transparent…) takes
- Tells you if the GPU is the limiting factor
- Combine with Rendering to decide whether the culprit is overdraw, shader complexity, or lighting
Memory
- Trend of total memory, GC heap, textures, meshes, audio
- Reveals resources that keep growing or scenes that never unload
- Use Memory Profiler for deeper investigation
Rendering
- Batches / SetPass / Draw Calls
- Visible objects, dynamic batching, SRP Batcher status
- Large spikes hint at missing culling, too many materials, or heavy UI
5. Timeline vs. Hierarchy
Both panes are at the bottom of the Profiler window.
Timeline
- Displays each system/function as horizontal bars per frame
- Bar length == time spent, nested bars show call stacks
- Hover to see detailed info
Technique: pick a high CPU spike, switch to Timeline, and expand the longest colored block (e.g., Scripts) until you find the exact method.
Hierarchy
- Tree list sorted by Total or Self time
- Easy to sort and identify the slowest functions
- Expanding nodes reveals the call hierarchy
Typically Timeline finds “which area is hot”, Hierarchy tells you “exactly which function”.
6. Practical advice
- Record a representative gameplay segment; don’t rely on empty scenes.
- Focus on persistent high cost rather than rare spikes (unless the spikes matter).
- After identifying a hotspot, experiment inside that system (scripts, rendering, memory).
- Re-run the exact same Profiler scenario after optimizations to confirm improvement.
Mastering the Profiler saves countless hours of guesswork later in production.
Original article (Chinese) on CSDN “uniGame”, CC BY-SA 4.0.
https://blog.csdn.net/alla_Candy/article/details/133344430